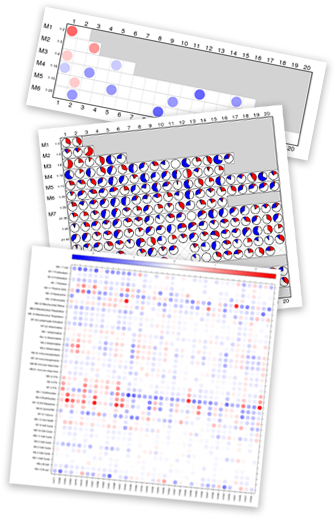
Welcome to the Module Analysis Wizard. It will walk you through the process of creating and viewing plots from your signal data. Logged-in users can choose to return to their results; if you are not a registered user, it will give you the option to provide your email address and use it to access your plots.
In order to generate your plots, you'll need the following:- the signal data file (for example, we support Illumina Background Subtracted and Affy zip files)
- information about your case and control groups, either in the signal data file, or to be entered via into the wizard interface.
More information about signal data files can be found in the module wiki along with additional information about this wizard.
